


Carbon Markets: The Wild Wild West
In today’s post, we are going to be doing a deep dive into the carbon markets - from the types of carbon markets, to methods for carbon pricing, to types of carbon credits.


In today’s post, we are going to be doing a deep dive into the carbon markets - from the types of carbon markets, to methods for carbon pricing, to types of carbon credits. For anyone who may not be familiar - the carbon market was created to encourage companies and countries to limit their carbon footprint. Because it is going to be such a long post, you can get the high level overview in the TLDR (“too long, didn’t read”). To anyone who sticks with us until the end - we hope this is a helpful resource!
TLDR
Carbon markets enable the trading of carbon credits to help companies compensate for their emissions and work towards their climate goals.
Companies buy carbon credits, which fund a GHG reduction or removal project such as reforestation.
There are two main types of carbon markets, based on whether emission reductions are mandatory, or voluntary: Regulatory Carbon Markets and Voluntary Carbon Markets.
Carbon credit markets grew 48% in 2021(Link). Factors driving demand include the Paris Agreement, technological gaps (operational emissions reduction limited by technology and cost), time gaps (not able to eliminate all emissions today), and investor pressure.
Avoidance / reduction projects prevent or reduce the release of carbon into the atmosphere. These may include avoiding deforestation or projects that provide fuel-efficient cookstoves.
Removal / sequestration projects, on the other hand, remove carbon from the atmosphere, where projects may focus on reforestation or biochar production.
The International Renewable Energy Agency predicts that cumulative decarbonization spending will reach $150 trillion by 2050 (Link).
As the market grows, the role of carbon crediting in meeting emissions goals is attracting higher scrutiny. (Link)
Some of the largest challenges for the voluntary carbon markets are:
Credibility of the project details and credits created
Standards vary as they are set by the individual registries
Lack of integration between voluntary markets and regulated markets

Source: World Economic Forum
Background: GHG Emissions and Climate Change
“Scientific evidence for warming of the climate system is unequivocal.” - Intergovernmental Panel on Climate Change
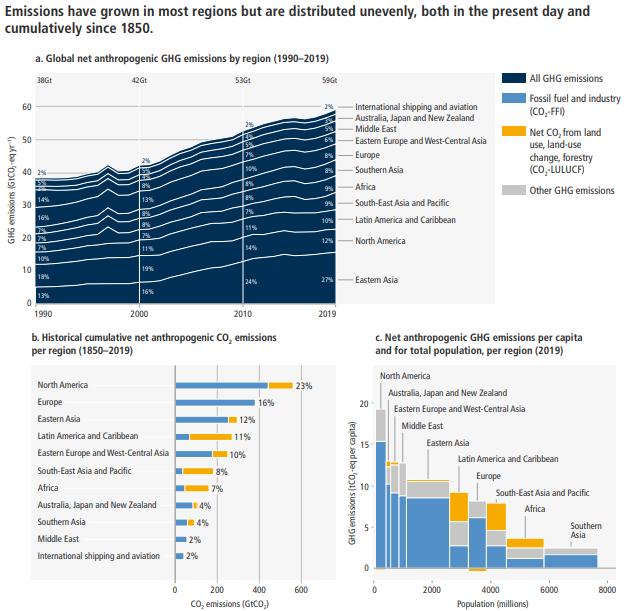
To set the stage for our discussion of the carbon markets today, we want to give a very brief background on why the carbon markets exist: climate change. Climate change is defined as long-term shifts in temperatures and weather patterns. Since the 1800s, human activities have been the main driver of climate change, primarily due to the burning of fossil fuels, which increases the concentration of greenhouse gasses in our atmosphere.
If you’ll indulge us for a second, we are going to put on our scientist hats and explain how greenhouse gasses work, for those who may not know. Greenhouse gasses in the atmosphere absorb infrared radiation and re-emit it in all directions, preventing it from escaping the Earth and heating up the atmosphere in the process. Gasses classified as greenhouse gasses include carbon dioxide (CO2), methane (CH4), nitrous oxide (N2O), and other fluorinated gasses. For our conversation today, we will be focusing on carbon dioxide and may use “carbon dioxide”, “CO2”, “carbon”, and “greenhouse gasses” synonymously.
Source: IPCC
In their latest Climate Change Mitigation report (Link), the International Panel on Climate Change (IPCC) describes emissions reduction AND removal as “essential” to mitigating the effects of climate change. Specifically, the IPCC estimates that we will need to remove up to 1000 Billion tons of carbon by 2100.
In order to meet international goals for a sustainable future, we will need to reduce greenhouse gasses in the atmosphere through a combination of reduced demand, renewable fuels, electrification, efficiency and technological development, and carbon capture and storage. To accomplish this, there will need to be a mix of policies and public and private investment.

Source: International Energy Agency
The Types of Carbon Markets
Overview of the market
Over the past few years, we have seen companies and now countries start adopting net zero targets. With this increase of commitments this has led to innovative and new ways to meet these goals. The demand for solutions has led to an increase of attention to the carbon markets and emission trading schemes. In fact, it is estimated by IETA that trading carbon credits could reduce the cost of implementing countries’ Nationally Determined Contributions (NDCs) by more than half – by as much as $250 billion by 2030.

Source: World Bank
One of the main drivers leading to increased attention is due to the recognition of carbon credits in the Paris Agreements, Article 6. Article 6 states that countries can voluntarily cooperate with one another to reduce the targets they set out in their NDCs. This means that one country can transfer their carbon credits they earned from the reduction of their emissions to assist another country to meet their goals. This allows for a global cooperative approach which will help alleviate costs by reducing emissions at the lowest cost.
Trading Systems
There are two primary ways to trade carbon: “Cap and Trade system” or a “Baseline-and-credit system”. In a cap and trade or known as emissions trading systems (ETS), a government will then decide and allow a maximum of GHG emissions (the cap) for a certain group of entities like countries or companies. This cap is divided into emissions allowances which are distributed to each entity. The entities then submit one allowance for each ton of carbon dioxide equivalent (CO2e) emitted throughout the year. The company or the country can decide if they want to buy additional allowances or sell the surplus allowances. (Link)

Source: Land Trust Alliance
For the “baseline-and-credit” system a regulator will decide how emissions (reduction or removal) can be generated by activities that would reduce emissions or would remove GHGs from the air. To generate the emission credit a verifier is necessary. The emission credits then can be used as an offset for emission targets. Think of the baseline and credit system as companies can earn credits if they produce fewer emissions than their baseline. From there, the company may choose to trade the credit to other companies that may need additional credits to cover their surplus.

Source: Cambridge
Voluntary vs. Regulatory
Carbon markets can be broken into voluntary carbon markets (VCM) and regulatory carbon markets (RCM). Regulatory carbon markets are created and regulated by mandatory national, regional, or international carbon reduction regimes. Regulatory carbon markets can offer higher prices due to the clarity around verification, but can struggle with adoption. Voluntary carbon markets function outside of compliance markets and enable companies and individuals to purchase carbon offsets on a voluntary basis with no intended use for compliance purposes. Voluntary carbon markets allow for a market solution with clear price discovery, but are currently challenged with opaque market functions, and a patchwork regulatory framework. We believe that the market for carbon, whether voluntary or regulated, is poised for dramatic growth over the next several decades.

Source: Visual Capitalist
One of the biggest challenges facing the carbon markets today is the pricing of carbon. Carbon pricing within VCM and RCM can vary fairly significantly, depending on geography, degree of governmental intervention and stage of voluntary market development. As we know from economics, pricing is a function of supply and demand. Global carbon credit markets consist of a diverse range of sources of supply and demand.
On the supply side, sources of carbon credits derive from international crediting mechanisms, regional/national crediting mechanisms, and independent crediting mechanisms. We will delve further into these mechanisms in our discussion of the voluntary carbon markets.
On the demand side, market segments include international compliance markets, domestic compliance markets, results-based finance (which uses carbon credit purchases as a public policy tool for incentivizing emissions mitigation), and the voluntary carbon market. Demand for carbon credits could increase by 15x or more by 2030 and by a factor of up to 100x by 2050(Link).
Deep Diving the Voluntary Carbon Markets
The voluntary carbon markets primarily consist of private entities purchasing carbon credits for the purpose of complying with their voluntary emissions reduction commitments. Within the voluntary credit markets, carbon credits are typically issued under independent crediting standards.

Source: Visual Capitalist
Increasingly, we are seeing companies set targets to reduce their carbon footprint. On the more aggressive side, we see companies pledging to be “Net Zero” emitters by 2050 or sooner. The UNFCCC’s Race to Zero initiative now reports 5,235 companies have made a commitment of this type, and pledges by Global Fortune 500 companies grew 17% between 2020 and the end of 2021.(Link) As we discussed in our post about the Five Things To Know About The Energy Sector And The Energy Transition, energy companies are some of the largest investors in climate change mitigation. Last year, energy companies led the way in purchasing credits, increasing their demand ninefold compared to the previous year(Link).
These commitments are driving demand in the voluntary carbon market segment. Companies are buying carbon credits to contribute to their climate targets or offset their emissions. Offsets are credits that reduce a company’s net emissions. They are the most common within the voluntary carbon markets, as companies purchase credits to cancel out emissions from their operations. ~43% of the world’s largest 632 public companies (measured by revenue) plan to use offsets — but two-thirds fail to specify any conditions on the use of offsets (Link).

Source: Markets in Motion State of the Voluntary Carbon Markets 2021
Mechanics of Transactions
In order for carbon to be traded, there needs to be a system of intermediaries to facilitate the transaction. Typically, this involves verification, registration, listing on a carbon exchange, and finally transaction.
Monitoring the Supply and Demand of Carbon Markets
In addition to primary participants in carbon markets, there are secondary participants who standardize the monitoring of available supply and demand through databases like the U.C. Berkeley’s Voluntary Registry Offsets Database (VROD). The VROD aggregates carbon management projects from the four largest voluntary offset project registries: American Carbon Registry (ACR), Climate Action Reserve (CAR), Gold Standard (GS), and Verra (VCS). Together, they total over 1.5bn tons issued across 5,000+ projects. (Link)
Issuances vs. Retirements
Typically, reporting focuses on carbon credits transacted, as opposed to those issued and retired. Retirement involves taking a credit out of circulation by an end user. Issuances and retirements offer insight into the direction of the market (Link). Issuances have historically outpaced retirements every year, resulting in a surplus of voluntary credits (Link). However, as companies receive pressure from their investors to make progress on their climate goals, we expect demand to increase.

Source: Markets in Motion State of the Voluntary Carbon Markets 2021
Match Offsetting Behavior with Year of Emissions
Intellectually, it makes sense that if a company is claiming that their purchase of carbon credits offsets their operational emissions, then the offsetting behavior (typically carbon capture and storage) should happen in the same year as the emissions. In practice, a consumer can retire a credit created a month ago or a decade ago. Carbon offsets tend to get cheaper as they get older, which makes them more desirable for customers. We can see this as the average age of retired offsets is increasing as buyers purchase older credits.
Carbon Direct found that the average vintage age rose to 6.1 yrs in 2021 (compared to 4.7 yrs in 2019 and 5.3 years in 2020) as a result of the retirement of older credits (including avoided deforestation projects older than ten years and renewable energy projects as old as fifteen years) (Link). The challenge here is that older projects often drive less immediate climate impact than new offset projects.

Source: Carbon Direct
Challenges
Tackling “Emission Leakages” with BCAs
One of the challenges arising from carbon policies is how independent and differing policies could negatively affect or create a disadvantage for some countries. Countries continue to refine and develop their initiatives to support their NDCs and in order to achieve the targeted goals countries will require climate policies, However, these policies will likely differ in terms of release time, coverage, and how stringent the regulations will be. As policies develop and new regulations are set in place this could cause unintended consequences where we see a shift of economic activities to countries with less stringent policies. This scenario is known as an “emission leakage” where a domestic policy to reduce their emissions leads to an increase in emissions to another location, essentially undermining emission reductions resulting from climate policy. As of today, this issue is relatively minimal but can rise in importance as policies continue to advance relating to carbon pricing. (Link)
One way to help mitigate “emission leakage” is to implement Border Carbon Adjustments (BCA). BCAs are potential trade-related options like a tariff, or import fee, imposed on certain materials or products which will help combat the adverse effects should one country have stronger climate policies to reduce emissions than others. (Link) They also could be viewed as an incentive for counties to adopt climate-related policies to avoid BCAs. Overall, they aim to account for differing carbon costs incurred in producing goods across jurisdictions that are subsequently traded internationally. The main objectives are to reduce emissions leakage, maintain the competitiveness of domestic industries, support great domestic climate ambition and drive international climate action. BCAs could generally be import charges or export rebates. An import charge would apply to goods from countries that either do not have carbon pricing or apply a lower carbon price to ensure they face similar carbon costs. The export rebate can be provided to producers so that domestically produced goods compete on equal footing in foreign markets alongside goods from countries with limited or no carbon pricing. (Link)
Where we are today no countries have implemented a BCA as they are extremely complicated to design and would require understanding the economic impact of domestic climate policy on produced goods and the impact on developing countries, and trade concerns. Because of their complicated structure some studies suggest the opportunity cost would be too great considering the expected benefits and challenges that implementation would cause.
In July 2021, the European Commission created and proposed a Carbon Border Adjustment Mechanism (CBAM) which would be the largest in existence. The CBAM was announced in the European Green, part of the “Fit for 55 Package”, and would serve as an essential element for the EU to meet its objectives. The goal is that it will avoid having reduction efforts of the EU offset by an increase in emissions outside of the EU through relocation of production or increased imports of less carbon-intensive products. The CABM was designed so that it would ensure that the price of imports reflects more accurately their carbon content. (Link) It's also important to know that the proposed CBAM is seeking to replace the existing mechanisms in place to address carbon leakage which is arising from the current EU ETS system. This is proposed to be an extension of the EU’s ETS system and the phase-in of the EU’s CBAM is expected to be coordinated with the phasing-out of the current free allocation of allowances to address the risk of carbon leakage because of carbon pricing in the EU’s ETS. (link)
The EU ETS and the CBAM have a common objective of pricing GHG emissions in the same sector and good through the use of specific allowances or certificates however the EU ETS sets an absolute cap on the GHG emissions while the CBAM will not establish quantitative limits to impact to ensure that the trade of flow is not restricted. (Link)
The EU isn't the only jurisdiction pursuing the potential adoption of BCAs. In the fall of 2020, Canada announced their intentions to explore the use of BCAs and moved forward with the study in 2021. A few key considerations were brought into question including what would be the economic impacts that BCAs would bring, how BCAs would impact Canada's international trading relationship, and how implementing this mechanism would advance their climate policies. In a letter released by the Canadian Government, there were a few specific areas of concern that caught our attention. The first being if applying an import charge on foreign goods would increase the ability of domestic producers to raise their prices to remain competitive. This would lead to downstream impacts for other manufacturers and then ultimately the consumer with a higher cost of goods. Another consideration that the Canadian government was exploring was how would the BCA be enforced and what reporting verification requirements would need to be put in place and what emissions should be subject to BCA? (direct and indirect). Canada continues to explore BCAs as a tool to address potential carbon leakage and the potential role it could play to help them meet their climate ambitions. (Link)
Double Counting
Another challenge that arises within Carbon Markets is the risk of double counting the same emission reduction or removal to emission reduction goals. If double counting is prevalent within the carbon markets this can lead to mistrust within the market concerning the value of the units traded as well as the overall integrity of the market. There are different types of double counting including double issuance, claiming, and double use of credits. Double issuance is an issue that arises when carbon registries are not connected or the markets are fragmented. What happens is two or more systems will issue the same credit for the same carbon reduction. Double claiming is when reductions are counted for twice, maybe downstream and upstream using credits. Lastly, double use is when the same allowance or credit is used more than once either in the same country or same company. This issue arises if a unit is transferred to another system or registry without being canceled in the initial one. (Link)
Carbon Pricing
Now that we’ve discussed how the carbon markets operate at a high level, we want to dig a bit deeper into carbon pricing. There is currently no universal way to price carbon. The biggest drivers of carbon pricing are additionality, measurability, and permanence.
Additionality describes decarbonization that otherwise wouldn’t have occurred if the offset hadn’t been monetized.
Measurability refers to the ability to quantify the emissions reduction.
Permanence is the likelihood that emissions reductions from a project can be reversed.
Carbon can be priced directly through a carbon tax or ETS or indirectly through price signaling. An example of indirect carbon pricing would be fuel or commodity taxes or subsidies. Below, we look at a chart from the World Bank, showing how different countries are pricing carbon. We can see that carbon prices vary widely, from $1 per ton to $137 per ton.

Source: World Bank
In addition to national carbon pricing schemes, companies are working to develop internal prices on carbon. This allows them to estimate how their profits might be impacted based on a hypothetical tax on the emissions from their operations. Investors are also using carbon prices to identify low-carbon, high-return investment opportunities. A study by McKinsey looked at 2,600 companies and evaluated which companies have developed an internal price on carbon. 23% of the companies indicated they are using an internal carbon charge, and another 22 percent plan to do so in the next two years (Link). Across sectors, internal carbon pricing was found to be the most common in the energy, materials, and financial sectors.

Source: McKinsey
Interestingly, the median prices also varied by industry,with pharmaceutical companies using the highest price for carbon and business services companies using the lowest price. Median carbon prices ranged from $5 per ton to $65 per ton.

Source: McKinsey
Carbon Credits
Having broken down carbon pricing, we now want to further breakdown the mechanics of carbon credits and fully understand the scale of the carbon credits market. Within the voluntary carbon markets, independent mechanisms with the highest issuances include American Carbon Registry, Climate Action Reserve, Gold Standard, the Verified Carbon Standard from Verra, Plan Vivo, and the Global Carbon Council (Link).
The carbon credit markets grew 48% in 2021, with the total number of credits issued increasing from 327 million to 478 million (Link). Below, we look at a graphic from the World Bank, which analyzes the global volume of carbon credit issuances over time, broken down by crediting mechanism.

Source: World Bank
Lifecycle of a Carbon Credit
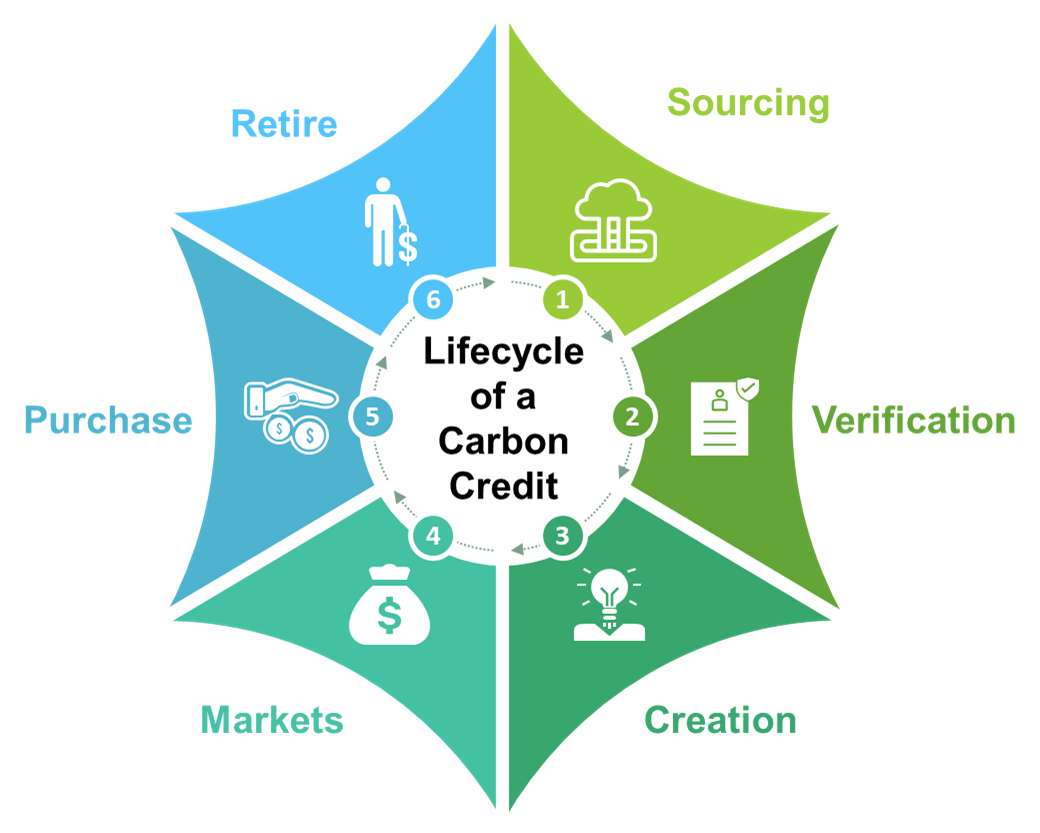
Now - we want to look at the lifecycle of a carbon credit. Carbon credits are sourced/generated as soon as the emissions reductions or removals take place (Sourcing). For the credit to be eligible for purchase, it needs to be verified by an independent verifier (Verification) and then registered with a carbon credit registry (Creation). After being registered, the carbon credits can either be purchased directly or sold through an exchange (Markets). The consumer then purchases the credit (Purchase), whereafter the credit is retired (Retire).
Sourcing
Sources of carbon credits are typically broken into four categories:
Renewable Energy: Certificates that allow the purchaser to claim that the energy came from a renewable resource.
Nature-Based: Credits generated from projects that avoid or remove GHG emissions through forestry or land use. Issuances of nature-based credits increased 159% over the past year and accounted for over a third of total issuances in 2021 (Link). Some resources indicate that nature-based credits are not only the lowest cost but could also provide sufficient supply for the entire voluntary carbon market.
Avoidance: Certified emissions reductions from projects that reduce emissions compared with the most likely course of action (Link). Removal and avoidance offsets are often part of the same project type
Removal: Credits from projects that remove GHG emissions from the atmosphere. Carbon Capture and Storage (CCS) and Direct Air Capture (DAC) are forms of generating carbon removal credit. Pure removal projects made up only 3% of all projects issuing credits over 2021 and 2022 YTD (Link).
CCS involves the capture of carbon from industrial sources and sequestration (most commonly in rock formations).
DAC is expensive technology that extracts CO2 directly from the air. There are currently ~20 plants operating globally.
A majority of carbon credits have been supplied by projects in Asia, Latin America, and the Caribbean. According to Ecosystem Marketplace, traded volumes of credits from projects located in Asia more than doubled in the past year, representing 56% of the total credits transacted in the market in 2021 (Link).

Source: World Bank
Carbon Capture, Utilization, and Storage (CCUS)
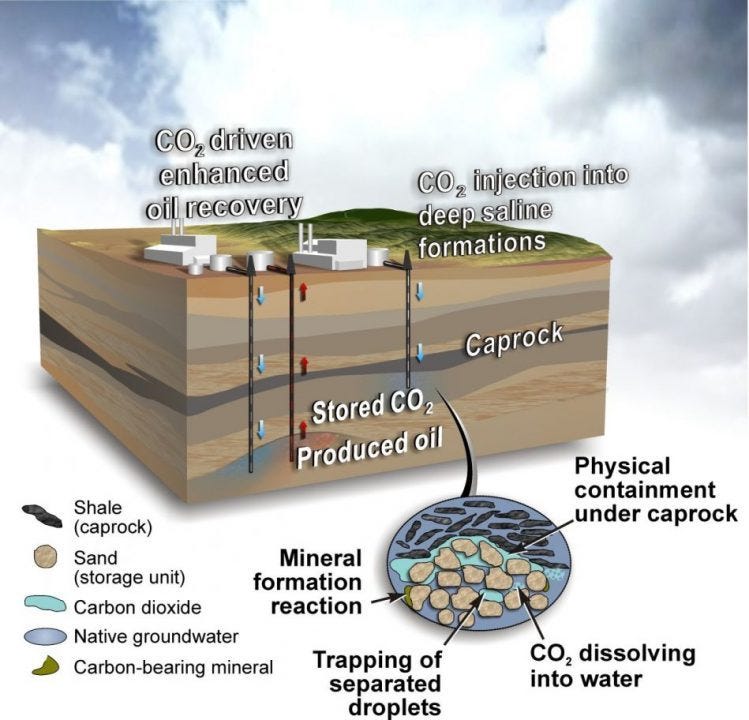
To expand on our discussion above about CCS, we want to provide an overview of Carbon Capture, Utilization and Storage (CCUS)..
CCS refers to the process of capturing CO2 and either storing it permanently, while CCU utilizes it either in enhanced oil recovery or in the manufacture of fuels, building materials, or chemicals. Both CCS and CCU involve carbon capture, but the difference between the two lies in what happens after. CCUS combined the two to include any processes that capture, utilize and/or store carbon in geologic formations such as oil and gas reservoirs, unmineable coal seams and deep salt reservoirs. These structures are used for carbon storage because of their historical ability to store crude oil, natural gas, brine and carbon dioxide over millions of years.
Source: Center for Climate and Energy Solutions
According to the International Energy Agency, there are around 35 commercial facilities applying CCUS to industrial processes, fuel transformation and power generation, with a total annual capture capacity of almost 45 Mt CO2(Link). Project developers have announced ambitions for over 200 new capture facilities to be operating by 2030, capturing over 220 Mt CO2 per year (Link).
While CCUS is estimated to achieve 14% of the emissions reductions needed to hit net zero globally by 2050, it is viewed as the only practical way to achieve deep decarbonization in the industrial sector. According to the Center for Climate Solutions, CCUS technologies have the ability to capture more than 90% of carbon emissions from power plants and industrial facilities (Link).

Source: International Energy Agency (IEA)
The United States and Canada account for 65% of annual capture capacity and have continued to support CCUS efforts by introducing new targeted policies (Link). The Inflation Reduction Act (IRA) extends and expands the 45Q tax credit, which incentivizes capturing carbon and storing it underground or in products through CO2 utilization. The credit amount nearly doubles for CO2 that is captured from power and industrial plants and more than triples for CO2 that is captured from DAC.
Additionally, the Infrastructure Investment and Jobs Act provided approximately $12 billion across the CCUS value chain over the next five years through R&D funding, loans and permitting support.
In Canada, the 2022 federal budget proposes an investment tax credit for CCUS projects between 2022 and 2030, valued at around 37-60% depending on the type of project (Link).
The Role of Financial Services Companies
Before we close out our conversation about the origination of carbon credits, it is worthwhile to briefly discuss the role of financial services companies. Over the last year, we have seen financial services companies that are increasingly involved at the implementation phase of carbon projects. At this stage, they provide capital and risk-hedging mechanisms to project developers who historically had to rely on funding from equity and grants for their upfront investments.
Verification, Creation, and Markets
Once a carbon credit is generated/sourced, it must be verified, created/registered, and then sold. Credits undergo a robust verification process, typically by an ISO accredited third-party verifier. Some of the largest carbon credit verifiers are Aster Global, Environmental Services, First Environment, GHD, S&A Carbon, SCS Global, SustainCert, and Ruby Canyon Engineering.
Once verified, credits are registered. Carbon credit registries allow for tracking to ensure emissions reductions are not double-counted. Some of the largest carbon registries are American Carbon Registry, Climate Action Reserve, The Climate Registry, Gold Standard, ICR, and Verra.
Finally, credits can either be purchased directly or sold through a brokerage or exchange. Some of the largest brokers and exchanges are Aegis, AirCarbon Exchange, Anew, Carbon Trade Xchange, ICE, Nori, TerraPass, and Toucan.
Purchase - What are Companies Doing?
In order for there to be a market for carbon credits, there of course needs to be a purchaser. Earlier in this post, we discussed demand dynamics in the carbon markets, so we won’t go too far in depth about why a company might want to purchase carbon credits. Once a company purchases a carbon credit, that credit is retired and they can use it to offset emissions from operations or make progress towards a climate-related commitment.
In data analyzed by Statista and collected from company filings and Bloomberg, we can see that Delta, Alphabet and Disney have all been some of the largest purchasers of carbon offsets since 2017. Since then, Delta has purchased 7.8 million metric tons of CO2 equivalent, followed closely by Alphabet with roughly 3.5 million and Disney with around 2.5 million between 2017 and 2019. Other substantial purchases have come from companies like Salesforce and JPMorgan Chase. (Link)

Source: Statista
The Role of Blockchain
If this discussion of the carbon markets wasn’t convoluted enough for you - we are now going to discuss the role of Blockchain. Distributed ledger technologies are increasingly being used in carbon credit market transactions.
To this end, the International Emissions Trading Association has recently formulated a set of initial recommendations and launched a Task Force on Digital Climate Assets to explore and work on guidelines for blockchain-based carbon markets (Link).
In a previous post (Blockchain, Crypto, and ESG – Oh, My!), we discussed the mechanics of Blockchain and cryptocurrencies, so we will keep it high level here. Tokenization is the process of creating a digital representation of something of value on a distributed ledger (or blockchain). Tokens can only be sold or transferred by their owners, ensuring they are unique.
If tokens are created through a standardized process, they can support overall carbon market liquidity. Information about the movement of carbon tokens as they are traded can be made transparent, including when the token is retired and can no longer be bought or sold.
An example of such an application is the Toucan Protocol, which provides what they call a “carbon bridge” for tokenizing carbon credits by buying and retiring credits from the Verra registry and issuing new on-chain assets called “Base Carbon Tonnes.”

Source: Toucan Protocol
Tokenization through the Toucan Protocol has enabled efforts like KlimaDAO, an organization that creates a digital currency called KLIMA and uses the DAO to sell bonds and distribute rewards to KLIMA holders. Within weeks of its launch in November 2021, KlimaDAO acquired over 9 million tokenized carbon assets (Link).Quickly though, it triggered controversy after bridging verified carbon units from a project type that was discredited in the early 2010s (Link).
Global Markets
Carbon markets have a global footprint. 60+ countries, cities, states and provinces have implemented or are planning to implement carbon pricing schemes, including emissions trading systems and carbon taxes (Link). Jurisdictions in Asia and the Americas have emerged as the driving forces behind new carbon pricing initiatives. Carbon pricing initiatives are expected to cover 20% of global emissions in the short term (Link).

Source: World Bank
United States
Most carbon pricing developments in the United States take place at the state level, which we summarize below.
California
We are going back about 20 years to take a look at California's climate ambitions. In 2005, the California Climate Action registry (CCAR) adopted the Forest Protocols to account for carbon emissions and reductions through forest conservation. At the time, this was a landmark concept for the state and saw the inevitable carbon markets on the horizon to come. Moving ahead a year later, California passed the California Global Warming Solutions Act of 2006 which authorized the California Air Resources Board (ARB) to regulate GHG emissions in the state by setting a cap. (Link) With the passing of this law, California was the first state in America to place a cap on emissions, specifically carbon dioxide and this was a key element in their strategy to reduce their emissions. Jumping ahead, major changes to the program took effect in January 2021 including the addition of a price ceiling, the inclusion of two allowance price containment reserve tiers below the price ceiling, reductions in the use of offset credits, and a steeper allowance cap decline to 2030 (Link). Also in the same year, the California Air Resources Board launched the Climate Change Scoping Plan update process during 2021, which seeked to develop policy strategies to achieve 2030 and 2045 targets (Link).
California’s cap-and-trade program was launched in 2013 and was one of the components in their California Global Warming Solutions Act as mentioned above. Like other emission trading systems, the program covered certain sections including large electric power plants, industrial planes, and fuel distributors. In an effort to expand trading and use of emission allowances (or offsets) California linked their cap-and-trade program with Quebec on January 1st, 2014 allowing both jurisdictions more options to reduce emissions. They also had linked with Ontarios as well 4 years later in 2018 but unlinked after the discontinuation of the program shortly after. (Link) Most recently, at COP26 in Glasgow, New Zealand signed a joint deceleration with California and Quebec to fight climate change by starting to share information, experiences, and best practices to promote integrity of carbon pricing instruments to reduce greenhouse gases.Part of this join effort is to start exploring options for New Zealand to join Californias and Quebecs cap-and-trade program. (Link)
Massachusetts
Compared to some of the other states we have looked at in this post, Massachusetts was ahead of the pack and developed a cap and trade system back in August 2017. The Massachusetts Executive Office of Energy and Environmental Affairs (EEA) led in establishing the system and it was officially rolled out in 2018. The initial goal of the program was to achieve an 80% reduction in emissions (from certain sectors) by 2050. (Link) In March 2021, Massachusetts passed a new climate law with binding emission reduction targets of 50% below 1990 levels by 2030 and 75% below 1990 levels by 2040, as well as net zero emissions by 2050. The state has published a slew of climate-related regulations along with the Massachusetts 2050 Decarbonization Roadmap report and their interim 2030 Clean Energy and Climate Plan (CECP).
Oregon
In 2020, Oregon put into place an administrative order to start reducing their GHGs by at least 80% below their 1990 levels by 2050. A key component to achieving their goals was to establish a cap for emissions and this program is now known as their Climate Protection Program (CPP). The program places a declining limit on GHG emissions from local fossil fuel distribution companies. Annual emissions allowances will be given out and similar to other systems we have described, one allowance authorizes one metric ton of CO2 emissions. The fuel suppliers will be able to trade their alliances with each other and the remaining balances are able to roll over. (Link)
Northeastern States (Connecticut, Delaware, Maine, Maryland, Massachusetts, New Hampshire, New Jersey, New York, Rhode Island and Vermont)
The Regional Greenhouse Gas Initiative (RGGI) consists of 12 states and is a non-profit corporation that aims to support the development and implementation of a CO2 Trading Program. This includes the implementation of a platform to action CO2 allowances, monitoring the market related to auctions and trading, and the ability to provide technical support to the participating states to evaluate applications for emission offers and proposed changes to the platform.
For background, the RGGI is a market-based cap and investment system focused on reducing emissions from power plants. The states that participate in the RGGI must acquire one RGGI CO2 allowance for every short ton of carbon they emit. Every quester allowances are distributed and some states will hold a limited number of allowances to sell at a fixed price. It is important to also know that the RGGI has no regulatory or enforcement authority. (Link)
Pennsylvania
In May 2021, the final regulation to establish an ETS in Pennsylvania covering CO2 emissions from the power sector was released. It would allow for RGGI participation starting in 2022, barring litigation or action from the state legislature. Pennsylvania’s share of emissions in the 2022 RGGI cap would be approximately 45% (Link).
Washington
In May 2021, Governor Jay Inslee signed into law the Climate Commitment Act, which puts in place an economy-wide cap-and-invest program that begins in January 2023 (Link).
In the US we have seen some developments as states move towards carbon pricing and establishing an ETS. In March 2021, the Transportation and Climate Initiative (TCI-P) was created and is a multi-jurisdictional collaboration of Northeast and Mid-Atlantic, and Southeastern states and the District of Columbia that seeks to improve transportation, develop the clean energy economy and reduce carbon emissions from the transportation sector (Link). Essentially the proposal is looking to require large fuel suppliers to pay for the pollution they rate by purchasing allowances for the pollution they sell. As part of this proposal, the development of an Emissions and Allowance Tracking System (EATS) will allow for the transfer of CO2 allowances (Link). The program is set to start in January 2023.
Canada
Canada’s carbon markets vary by territory. British Columbia, for example, has a carbon tax, Quebec and Ontario have cap-and-trade systems, and Alberta has a hybrid system that combines a carbon tax with a cap for large industrial emitters. Last year, Canada’s government launched a review of output-based pricing system (OBPS) regulations. The consultation paper proposed an annual tightening rate of up to 2% for facilities under the OBPS from 2023 (Link).
In August 2021, the federal government confirmed the minimum national carbon prices through 2030 and strengthened the minimum national stringency criteria for carbon pricing systems.
The federal Greenhouse Gas Pollution Pricing Act has been subject to court challenges by multiple provinces, but on March 25, 2021, the Supreme Court of Canada ruled that the legislation is constitutional. The fuel charge rates are based on a carbon price of CAD 50/tCO2e in 2022. The recent revision to the policy extended the price trajectory up to 2030, with the minimum rate increasing by CAD 15/tCO2e each year, until it reaches CAD 170/tCO2e in 2030 (Link).
Europe
The first ETS was established in 2005 by the European Union and it was and is the main tool to help reduce GHGs. Since its initial launch, the EU ETS remains the largest carbon market by traded value and continues to see record activity. The ETS covers more than 11,000 power stations in 27 EU member states. As discussed earlier, the EU ETS operates on the cap-and-trade principle meaning within the limit, companies can buy and sell emission allowances when needed. Some companies may get allowances for free but to cover the rest of their emissions they may need to buy additional allowances or use any surplus allowances they have saved. Ensuring compliance is critical so companies must monitor and report their emissions each year. Additionally, companies get their emissions verified.
In July 2021, the European Climate Law came into effect setting new 2030 climate targets. The updated target included a 55% cut in GHG emissions compared to their 1990 levels and zero emission by 2050. Over the last year, the system is expected to make major changes. This includes the introduction of the CBAM (discussed under our challenges section) which will price imported good based on the embedded emissions, the inclusion of the maritime sections (this includes sea transport), and the gradual phase-out of free allocation to aviation sectors. (as a reminder, free allocation refers to allowances given to a company by the government instead of through auction) (Link).
The EU has proposed a four stage plan for the development of their carbon market and we are currently entering the last stage. In this state more counties are covered, more industries are participating, and the reduction targets have increased.

Source:ScienceDirect
UK
The UK Emissions Trading Scheme (UK ETS) replaced the UK’s participation in the EU ETS on January 1st, 2021 (Link). However, their trading system does try to replicate the EU ETS. Like the EU ETS, the UK ETS applies to energy intensive industries, the power generation sector and aviation. It allows for free allocation and from 2022 onwards, free allocation will be allocated on or before 28 February of each calendar year.
Last year, the UK government proposed and published their Net Zero Strategy which set out policies to decarbonize the UK economy. Included in the proposals was how their ETS would contribute to hitting their targets. Like other ETS systems we have explored, the UK ETS also operates on a ‘cap-and-trade' principle and participants are required to obtain allowances equivalent to their annual emissions under this scheme. The UK has explored options to eventually link their system to the EU ETS due to the increased concern of emission leakages. The government remains open to potentially doing this but as of now there have been no commitments to do that. (Link)
China
China currently hosts the world's largest carbon markets by emissions traded and there's no plans on stopping its growth. China's national carbon emission trading system is known as the CN ETS and is viewed as a key pillar in helping China reach their decarbonization strategy goals. Prior to the development, China conducted eight years of research and development of their pilot carbon market. Several regional ETS pilots in 4 different cities were initiated in 2013-2014 until the national market was started in 2017. Each pilot program in each city presented a variety of challenges but the program proved to be a success. Beijing proved to have the largest number of market participants and ended up requiring companies to select a new third-party verification agency to verify their carbon emissions every three years, to limit repeated interactions with the company. The Hubei Province and Shanghai pilots were also among the pilot programs that saw a lot of success. As a result of these programs, China was able to establish a framework for carbon emission trading with controls and verification (Link).
Unlike the EU ETS, the CN ETS does not set an absolute cap but rather allocated carbon allowances free of charge to each emission entity based on a benchmarking method that compares the average carbon intensity of the power sector with each individual emission entity. This intensity-based approach is viewed as more lenient and is more supportive in collecting trading data that will be crucial for future development (Link).
In July of 2022, 194 million tons of carbon emission allowances worth over US $1B had been traded over the year. Moving forward, China continues to focus on the integrity of their MRV systems (monitoring, reporting and verification), effective sanctions for non-compliance, and strong security measures (Link).
New Zealand
The New Zealand ETS or known as the NZ ETS, was first proposed in the Climate Change Response Act 2002. The purpose of this proposal was to provide a framework in which the country could develop and implement clear and stable climate policies. In order to meet its obligations to the Paris Agreement, New Zealand started its ETS to encourage efforts towards its goal.
Under their system, companies are required to report their GHGs, surrender one “emission unit” to the government for each one ton of carbon they emit, and the government will reduce the number of units supplied over time. As we have seen in other ETS systems, emitters can buy and sell units from each other and the prices of the units reflect the supply and demand (Link). In New Zealand, all sectors apart from agriculture pay for their emissions
As of last year, there were a number of changes to the Climate Change Response Act. Part of the changes included a new cap on the unit supply and the implementation of auctioning mechanisms. When auctioning began in March of 2021, over 19 million allowances were made available (Link). As reported in June 2022, New Zealand suspects demand for units is projected to increase over the volume supply going into 2023 (Link).
Carbon Markets Outlook - 2023 and Beyond
It’s the moment of truth for the carbon markets. Ambitious climate commitments from companies and sovereign entities alike, has brought on the carbon offset “gold rush”. According to Bloomberg, demand for credits could grow 50x by 2050 (Link). As we discussed in the Carbon Pricing section, there is a range of carbon prices. As demand increases, the price of carbon offsets is expected to rise significantly, creating a $190 Billion market by 2030 (Link).
This year, companies have retired over 127 million offsets, up from 93 million through all of 2020. According to a study by Bloomberg, if the offset market continues to operate as it does today (dominated by companies trying to hit net-zero goals), offset demand could hit 5.2GtCO2e by 2050. Alternatively, Bloomberg notes that if the offset market transforms into a mechanism primarily for countries to achieve their emissions goals, demand is likely to top out at 3.4GtCO2e in 2050 (Link).
Bloomberg lays out 3 different scenarios for the evolution of carbon markets:

Source: Bloomberg
Removal Credits Only (SBTI) Scenario: Groups like the Science Based Targets Initiative (SBTI) are pushing for the use of only removal offsets to achieve net-zero emissions. This would mean that offsets from sectors like REDD+ and clean energy will no longer be available for companies to use to achieve their sustainability targets. This would, in turn, put pressure on removal sectors like reforestation and direct air carbon capture (DAC). Even at max capacity, these sectors can only supply 1.4 billion offsets in 2030 and 4.5 billion in 2050 (Link). This would cause prices to skyrocket.
Voluntary Market Scenario: According to Bloomberg, the offset market is oversupplied today. 122 markets globally include projects registered to issue offsets, which could realistically supply 6.8 billion offsets annually by 2050. If supply exceeds demand, offsets will be unsustainably cheap. Bloomberg’s study indicates that an oversupply amounting to 3.5GtCO2e will exist in 2030, keeping prices at just $11/ton (Link).
Hybrid Scenario: In this last scenario, the market looks like the voluntary market today, where a sharp increase in corporate demand drives up prices through 2030. This scenario then assumes that companies follow SBTI’s guidance after 2030, and only removal credits are allowed. This drives up prices initially before dropping back down in 2040 when demand primarily comes from countries that aim to meet their emissions pledges. In this scenario, prices are at $120/ton in 2045 and drop to $99/ton in 2050(Link).
For those of y’all who made it this far - thanks for sticking with us as we nerd out over the carbon markets. We hope it was helpful!

Glossary
Cap and Trade: Cap and trade programs have been around since the 80’s. This system was instrumental in the phase out of lead in petrol despite the skepticism among environmentalists. The system was rolled out by President Regan and continued by President Bush who then introduced a cap on sulfur dioxide. The goal was to create a system for power plants to trade allowances of their emissions. While this system was quite effective, we haven’t seen the rapid adoption by greenhouse gas emissions yet. (Link)
Carbon Capture, Utilization, and Storage: Carbon capture, utilization and storage (CCUS), also referred to as carbon capture, utilization and sequestration, is a process that captures carbon dioxide emissions from sources like coal-fired power plants and either reuses or stores it so it will not enter the atmosphere. (Link)
Carbon Credits: Carbon credits can be sold and bought on electronic trading system systems known as the carbon markets. One tradable carbon credit equals one ton of carbon dioxide or the equivalent amount of a different greenhouse gas.
Carbon Crediting Mechanism: Carbon crediting mechanism refers to a system where tradable credits (typically representing a metric ton of carbon dioxide equivalent) are generated through voluntarily implemented emission reduction or removal activities.(Link)
Carbon Markets: A market that is created from the trading of carbon emission allowances to encourage or help countries and companies to limit their carbon dioxide (CO2) emissions. This is also known as emissions or carbon trading.
Carbon Sequestration: The long-term storage of carbon in natural (plants, soils, geologic or carbon sinks formations, the ocean) and artificial (e.g. underground tanks) reservoirs (carbon ‘sinks’).
Carbon Tax: A carbon tax is a policy instrument through which a government levies a fee on GHG emissions, providing a financial incentive to lower emissions.(Link)
Emissions Trading System: An emissions trading system involves placing a limit or cap on the total volume of GHG emissions in one or more sectors of the economy.(Link)