


Equity Analysis: Starting with the Fundamentals
Today’s blog post will focus on how to look at a company through the eyes of a financial analyst.


Today’s blog post will focus on how to look at a company through the eyes of a financial analyst. Our goal is to impart some of the knowledge we gained early in our careers and make equity analysis (and investing overall) less daunting.
When assessing the current financial condition of a stock, a fundamental equity analyst will look at a variety of indicators. The most common is to start by evaluating the information contained in the financial statements including the balance sheet or profit and loss. Additionally, equity analysts utilize a range of ratios to compare the company’s relative performance. Profitability ratios, liquidity ratios, leverage ratios, and valuation help an analyst determine how the stock is performing. These ratios can all be found on Yahoo Finance, Google Finance, or Bloomberg. Financial ratios help analysts compare a company’s performance against another company, index, or benchmark and are helpful in understanding the performance over time.
Along with accessing the fundamentals, you might also have noticed something called a CDP score or a sustainability score. These scores focus on the environmental, social, and governance performance of the company (something we have talked a lot about in prior posts). In this blog post, we deconstruct how to interpret key financial ratios to assess the financial condition of the stock as well as what the sustainability scores can tell us.
Where to Start
If you are looking to get a quick snapshot of a company our go-to is Yahoo Finance or Google Finance and you’ll come to a screen like the one below.

In this post, we will breakdown a few of financial ratios and how to interpret them to help understand the financial condition and sustainability profile of the stock.
Valuation Ratios
Valuation ratios are used to understand the cost of a stock and utilized by an investor to see if a company is undervalued (cheap) or overvalued (expensive). If a stock is undervalued, an investor will want to invest in the stock in hopes that the stock price will rise as the company reaches its true value. On the flip side, an investor may want to sell an overvalued stock, because the stock price will eventually decrease to meet the company’s true valuation. Two of the most common valuation ratios include the Price to earnings ratio (P/E) and the Enterprise Value to Revenue (EV/Revenue). We will be digging into these two in more detail below.
Additionally, equity analysts can also look at ratios like Price to Earnings to Growth (which evaluates price in terms of both current earnings and expected growth), Price to Sales (which evaluates what an investor pays for $1 of revenue earned by the company), Price to Book (which evaluates what an investor pays for $1 of the company’s net assets), and Enterprise Value to EBITDA (which, similar to EV/Revenue, evaluates a company’s total value, including the value of its debt. However, unlike EV/Revenue, this metric normalizes enterprise value as a function of earnings before taxes, depreciation and amortization).

Price to Earnings
Let’s start by understanding what the P/E ratio is and how to interpret it. If we are looking at Yahoo Finance for metrics, you may notice there’s both the Trailing P/E and the Forward P/E ratio. The difference between the two is the trailing is a backward-looking indicator while the forward P/E is based off forward looking future estimates.
How to Interpret
The P/E ratio gives an investor an estimate on how much they will have to pay for $1 of earnings. For example, if a company has a P/E of 15, then the current share price is 15 times last year’s earnings per share and would take 15 years to earn back the purchasing price. If we compare a P/E of 15 to an index with an average P/E of 20, the stock is viewed as “cheaper” and potentially undervalued relative to the broader set of companies.
Enterprise Value to Revenue
The EV/Revenue is another valuation metric widely used by investors or analysts. Enterprise value allows the investor to understand how much the company is worth and provides a more comprehensive assessment compared to the market cap. By putting the company’s enterprise value over revenue (annual sales) we can understand the company’s valuation to the amount of revenue generated annually.
How to Interpret
EV/Revenue indicates how many dollars of EV are generated by one dollar of yearly sales. The lower the ratio, the cheaper the company is. Often, investors will favor Enterprise Value/Revenue over Price to Sales because the latter metric uses market cap as the numerator and doesn’t take a company’s debt into account.
How Do Investors Use Valuation Multiples?
Value investors perceive undervalued stocks as an opportunity and therefore will look for companies they believe are cheap relative to the market (along with other metrics like a high dividend). Growth investors will look for stocks with higher multiples indicating they are expected to generate a higher return or sell the stock at a high price. However, growth stocks typically do not have a dividend and tend to be a little more volatile than those classified at “value”. Instead of paying out their investors in dividends, they are reinvested into the company to feed the growth.
Management Effectiveness
The next set of metrics we are going to break down is the “Management Effectiveness” metrics including Return on Assets (ROA) and Return on Equity (ROE). Both of these metrics are ratios used to assess the profitability and efficiency of the company by evaluating either equity or assets. We are not going to go into the weeds on how each is calculated but at a high-level ROA is the company’s net income1 / total assets while ROE is net income/equity.

How to Interpret
One of the key differences between the two ratios is that ROE focuses on capital efficiency and the return from investments while ROA focuses on the return from the company’s assets.
When assessing these ratios, keep in mind a higher percentage is better because it indicates the company is generating more revenue from investments and therefore creating more profit.
Tip: ROA metrics are best used when comparing companies in a similar sector. For example, an oil and gas company is going to have different assets than a company in the food and beverage industry or a consumer company. Both metrics should also be evaluated over time to assess if the company has made good investments or is able to turn more profit from its assets over time.
Liquidity and Leverage Ratios
Moving on to our balance sheet we focus on liquidity and leverage. Liquidity ratios measure the ability of a company to raise cash when the company has to make short-term payments to its creditors. There are two common liquidity ratios we are going to introduce in this blog: Current Ratio and Quick Ratio.

Liquidity Ratios
Both of these ratios will provide insight into the ability of the company to pay short-term debt obligations and have the cash on hand to pay for short-term expenses. Companies that do not have sufficient liquidity will struggle to meet their obligations and may have to resort to financing outside the firm.
Current Ratio = (Current Assets / Current Liabilities)
Quick Ratio = (Cash + Market Securities + Receivables)/ Current Liabilities
How to Interpret
Companies that have a Current Ratio of 1 means their current assets exactly match their current liabilities therefore a company with a higher current ratio is more likely to be able to meet its short-term obligations.
The Quick Ratio provides an immediate look at the company’s liquidity profile as it only looks at cash and highly liquid assets. Inventory is excluded from the quick ratio as there might be a time lag to sell the inventory.
Leverage Ratios
Leverage ratios, like liquidity ratios, evaluate a company’s balance sheet (assets & liabilities). Leverage ratios refer to a company’s ability to meet long-term debts and continue operating in the future. There are a number of leverage ratios, but the most common is Debt to Equity. If this ratio is greater than 1, then more of the company’s financing comes from debt rather than equity. Other ratios include Debt to Total Net Worth, Total Liabilities to Equity, Total Assets to Equity, and Net Debt to EBITDA.

Source: Corporate Finance Institute via Eloquens
How to Interpret
Higher leverage ratios can indicate a higher level of risk, especially for an investor in a company’s equity. This is because in the case of default (or bankruptcy), equity holders are paid out last (after creditors, administrative costs, wages and taxes). However, leverage is not always bad. As we know in investing, more risk has the potential for more reward. Leverage can be used to fund growth opportunities and improve a company’s value in the long term (as long as the company can pay back its creditors).
Share Statistics
There are three share statics we are going to break down to understand an investors ability to access and easily re-sell a given stock.
Trading Volume
Trading volume looks at how often the stock is traded during a certain period of time. Stocks that trade often will reduce liquidity risks. This is the risk that measures how easily you can sell the stock and convert the shares into cash.
How to Interpret
Stocks that do not trade often will be more challenging to sell if you want to liquate your position. Typically, we will see stock volatility increase with a company event, like earnings, or if there is any uncertainty or structural changes in the company. It’s important to note that spikes in stock volatility can be due to good or bad events and are not always as negative. Contingent on the market cap of the stock, usually a company that trades less than 100,000 shares a day can be considered as having low trading volume.
Side Note: Trading volume tends to be quite volatile during times of uncertainty. This was the case during March 2020, the peak of Covid when the market tumbled an astonishing 7% - kicking in the market circuit breakers (thresholds at which trading is halted market-wide for single-day declines in the S&P 500 Index). While we were working at the NASDAQ, this was something many of our colleagues including ourselves had never experienced. There are three different levels of circuit breakers, all designed to halt trading to give the market some time to cool off. The majority of trades that are made on a daily basis are algorithmic driven, meaning any type of event can trigger an algo to buy or sell specified stocks. When the market was slipping quickly, this created a snowball effect triggering more and more algorithms to sell thus leading to a level 1 halt. The last time this happened was back in 2008 when the market was down 8.9%. [3]
Shares Outstanding & Float
Moving further down our share statistics, we see shares outstanding. Shares outstanding are the total amount of shares that the company has issues. These shares can be held by insiders at the company along with shares that are on the market to be traded. The float, which we can think of as a subset, just represents the number of shares that are available for training and publicly owned. Therefore, this number will not be bigger than the shares outstanding.
How to Interpret
By looking at the difference or gap between the shares outstanding and the float, an analyst can gauge understanding if there is a lot of insider ownership. This could possibly indicate that the company is bullish on the company, therefore, increasing their own ownership. We can also understand how liquid the stock is. If the float is close to the shares outstanding, this indicated there are a lot of shares being traded publicly.
Short Interest
The last Share Statistic metric we are going to look at is short % of shares outstanding. When someone shorts a stock they are essentially betting on the stock is going to go down. The buyer will borrow the shares, sell them to another trader, then buy them back to return to the broker. If the stock does go down, the trader will make a profit on the difference the stock went down.
How to Interpret
The short % of shares outstanding tells us the percentage of the shares that have been shorted from all the shares that have been issued. If a company have a high percentage of short interest, this can be a bearish indicator.
Sustainability Factors
Yahoo Finance discloses a few different sustainability scores that an analyst can evaluate in parallel to looking at the fundamentals.
ISS Governance Score
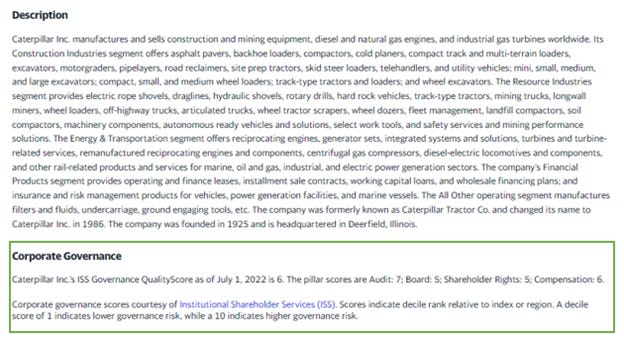
Under the “profile” tab and at the bottom of the page is a section called Corporate Governance. Governance plays a significant role when assessing a company’s sustainability profile as it is the framework and procedures a company has implemented to govern how a company’s board operates a company. Strong corporate governance practices take into account upholding ethical behaviors, compliance procedures, transparency, and balancing the interest of all stakeholders within the company. We all heard about the infamous Enron Scandal. [2} This would be the exact opposite of strong governance practices.
Yahoo displays a corporate governance score called an ISS Governance Quality Score which a risk score from 1-10. A score of 1 indicated the company has lower governance risk while a score of 10 indicates higher governance risk. Factors that are assessed include board structure, compensation factors (CEO total compensation to employees’ median pay), shareholder rights, and audit and risk oversight
.
Sustainalytics Risk Score
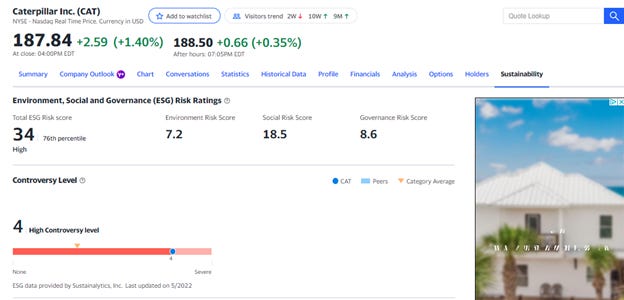
The second sustainability score we are going to look at is located under the “sustainability” tab.
This is a score given by a third-party rating agency called Sustainalytics. Sustainalytics provides a wide range of ESG services including issuing companies ESG risk scores. Many other financial service firms will utilize them as a data provider as well like Morningstar or FTSE.
Unlike the ISS Quality Score, Sustainalytics measures the degree to which a company’s economic value is at risk driven by ESG factors. The score also incorporates the level of exposure a company has to ESG risks and how management assesses and mitigates these risks through programs and policies.
Below the risk rating, companies will also get a Controversy Score which assesses the severity of any incident or corruption that took place. After identifying any incidents, Sustainalytics will score each incident 1-5 with 5 being most severe. Any news article, NGO source, or press release is scrapped by Sustainalytics’ algorithms so anything in the public realm is fair game. Once the incident is identified, Sustainalytics classifies which environmental, social, or governance category the incident falls into and then evaluate the impact, risks, and management response. The goal is to provide a quick snapshot of any environmental or social events that resulted in a negative impact on stakeholders or reputation.
CDP Climate Scores
For those that use Google Finance, on the main page you may see “CDP Climate Change Score” which stands for the Climate Disclosure Project. To get scored by CDP, companies are to fill out a voluntary climate survey which is quite extensive and can take weeks to complete. The best score a company can receive is an A while an F means the company did not provide sufficient information.
According to CDP, more than 6,800 companies respond to their survey every year and investors representing over $100 Trillion in assets leverage the scores. While there are sector specific questions, most of the questions will include understanding risks and opportunities climate poses to the business, emissions reporting, energy consumption, carbon pricing, and supply chain-related questions.
If you want to leverage the CDP score when evaluating a company’s ESG profile keep in mind just getting a score from them is an accomplishment. Due to the complexity and the time it takes to fill out a survey, some companies might not have the resources or team to do so especially micro or small-cap companies.

FOOTNOTES:
[1] Net Income is the total amount of revenue earned after a company subtracts their expense like operation expense, cost of goods sold, and taxes.
[2] Enron was an energy company in the early 2000s that is known for its poor governance practices due to numerous unethical accounting and risky audit practices were conducted. Enron ended up declaring bankruptcy and thousands of employees paid the cost by losing their 401Ks while and their lead auditor Arthur Andersen, was found guilty for overlooking the books and obstructing justice. This incident was one of main drivers that led to the Sarbanes-Oxley Act.
DISCLAIMER:
The information in the Blog constitutes the authors’ own opinions (and any guest bloggers posting from time to time) and it should not be regarded as a description of services or opinions provided by Pickering Energy Partners LP.
The opinions expressed in the Blog are for general informational purposes only and are not intended to provide specific advice or recommendations for any individual or on any specific security or investment product. The views reflected in the commentary are subject to change at any time without notice.
Nothing on this Blog constitutes investment advice or any recommendation that any security, portfolio of securities, investment product, transaction or investment strategy is suitable for any specific person. You should not use this Blog to make financial decisions and we highly recommended you seek professional advice from someone who is authorized to provide investment advice.