

Personal Finance 101: How to Invest through Economic Cycles
Personal Finance 101: How to Invest through Economic Cycles
With data coming out this past week on the shrinking of the U.S. economy for a second quarter in a row, we want to provide an overview of economic cycles and what they mean for investing.


Picture source: Forbes
First Off – What Are Economic Cycles?
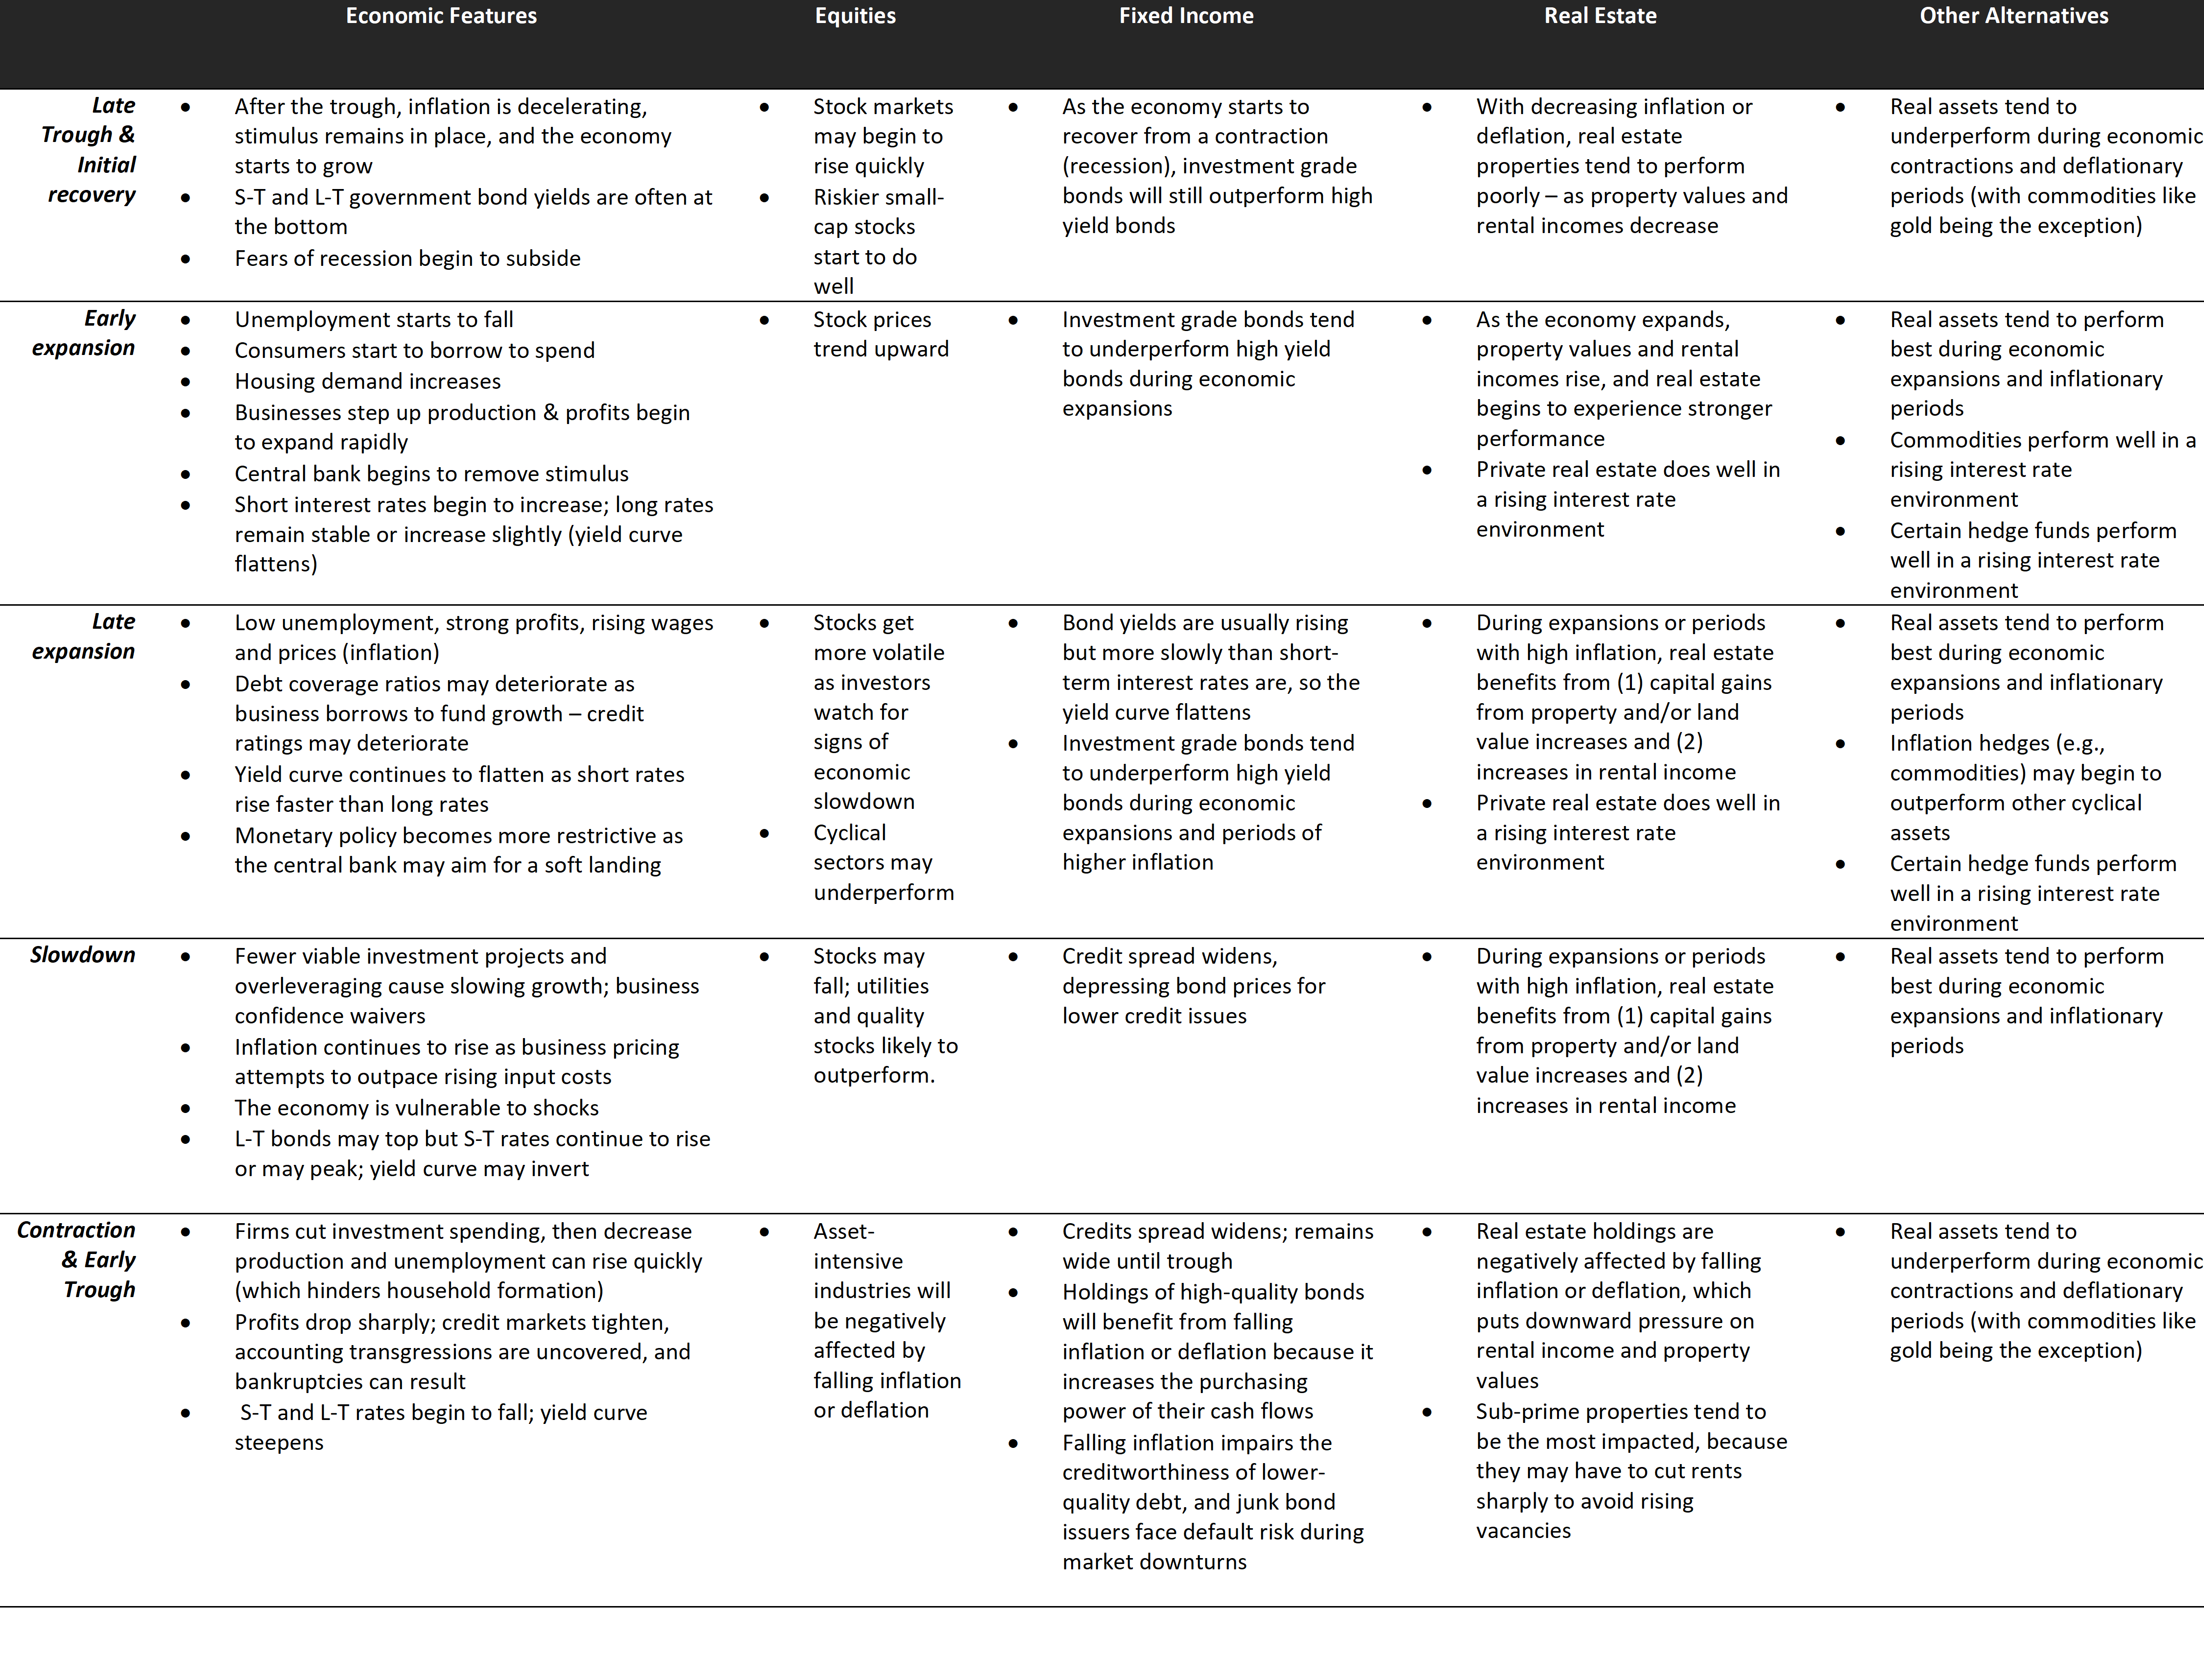
Economic cycles are trends in the economy that can be classified based on historical performance and characteristics and used to predict future changes. Typically, economists classify economic cycles into four stages: (1) expansion, (2) peak, (3) contraction, and (4) trough. Factors like gross domestic product (GDP), interest rates, levels of employment, and trends in consumer spending can help us identify the current stage of the economic cycle. The chart below visualizes economic cycles & provides some high-level characteristics.

So, Are We in A Recession?
The technical answer here is that two quarters of continued GDP decline is classified as a recession. With data coming out this past week on the shrinking of the U.S. economy for a second quarter in a row, this means we are technically in a recession. However, other indicators of economic contraction tell a mixed story[1][2].
Indicators of economic strength:
o The labor market is still strong - As of June, 98% of jobs lost during the pandemic had been recovered[3]. Unemployment has remained at its historic lows in 2022[4], and the U.S. economy has added 2.2 million jobs since January[5].
o Consumer spending is high – Data from the Bureau of Economic Analysis shows Americans are saving much less than they did a year ago[6].
Indicators of market correction:
o Inventories are shrinking – this indicates that companies expect consumer demand to slow.
o Inflation is high and rising – U.S. prices jumped by 9.1% year-over-year, according to the most recent data from the Bureau of Labor Statistics[7].
o Interest rates are high and increasing - the Federal Reserve has approved a series of interest rate hikes this year to inflation in check[8].
o The yield curve has inverted – According to CNN, an inverted yield curve is often seen as a signal that investors are more nervous about the immediate future than the longer term, leading interest rates on short-term bonds to move higher than those paid on long-term bonds[9].
In Case You’re Short on Time – Here’s the TLDR of Investing Through Economic Cycles
How to Think About Investing Through Economic Expansions and Contractions
There are a variety of different asset classes here. Because most people invest almost exclusively in equities, we will be focusing a majority of our conversation today on the performance of different types of equity factors throughout economic cycles. We would be remiss, however, not to mention other asset classes such as fixed income (this is going to be your government bonds, inflation linked bonds, investment grade corporate bonds, and high yield/higher risk corporate bonds), real estate (this will be your public real estate assets like REITs and private real estate investments), real assets (like tradeable commodities, farmland investments, energy investments, and infrastructure investments), and hedge funds.
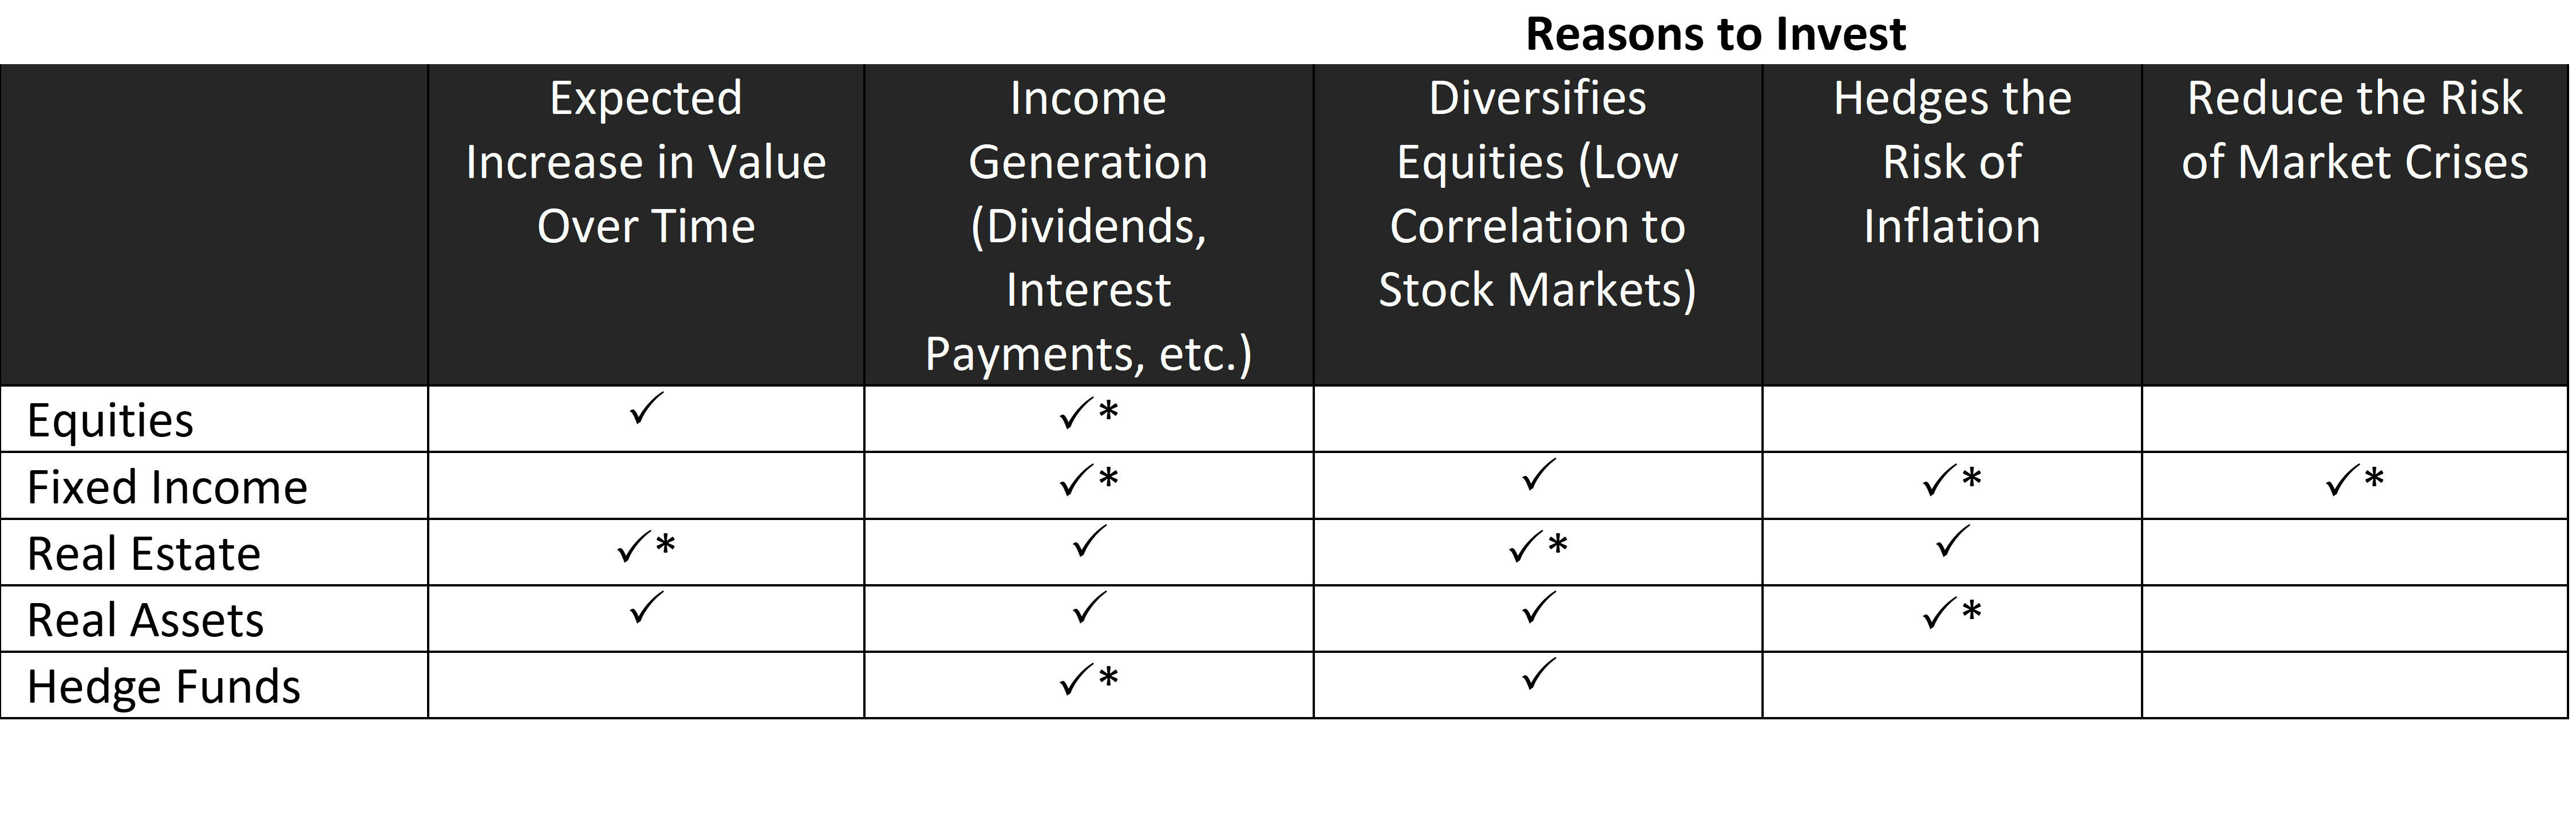
* - Indicates that some types of this security reflect the reason to invest, but not all. For instance, commodities like gold are inflation-hedging, while others exhibit high correlation with inflation.
Investing in Equities (Think: Stocks)
Factor Performance: Growth vs. Value
The relationship between growth/value factor tilts and performance during economic cycles has been rigorously studied. It has long been thought that while growth outperforms value during economic expansions, value outperforms during recessions. In fact, a recent study by Putnam Investors concluded more specifically, “looking back at the recessions of 1980, 1982, 1991, 2001 and 2009, we find that growth tends to outperform value in the 12 months prior to a recession through to the trough of the recession. As the economy exits a recession, value tends to outperform growth for the next 5 years”[10].
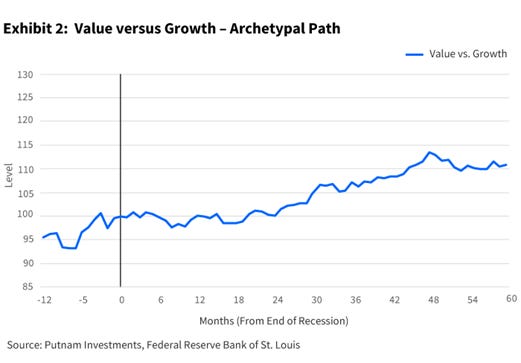
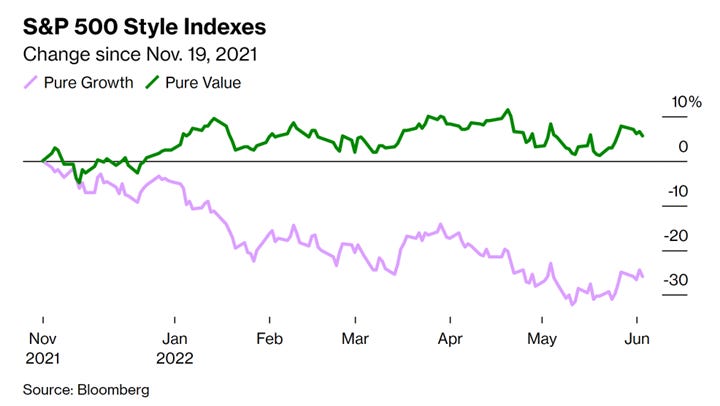
We see this theme in the current macro-economic environment. Bloomberg assessed the performance of the S&P Pure Value and Pure Growth indices since November 2021, and concluded: “since the middle of November, the [S&P Pure Value] index has returned close to 8% with dividends. Over the same period, its sister index, the S&P Pure Growth, has lost investors 25%.”[11]
Sector Performance: Cyclical vs. Defensive
Cyclical stocks and sectors (such as Energy, Materials, Industrials, Financials, Information Technology, Real Estate, and Telecommunications) have a direct relationship to the economy, while non-cyclical sectors (such as Consumer Staples, Health Care, and Utilities) include companies that produce goods and services that people continue to buy through all business cycles. During economic expansion, cyclical sectors (especially Information Technology and Industrials) tend to outperform the market. During recessions, all defensive sectors tend to outperform. Fidelity Investments conducted a more granular analysis of sector performance during the four phases of the business cycle. The findings are summarized below.

Source: Fidelity[12]
Size Performance: Small Cap vs. Mid Cap vs. Large Cap
Small companies (“small cap”) tend to be the most sensitive to changes in the economy. As such, they have historically had more rapid deterioration of returns during recessions. However, research conducted by Prudential indicates that small caps may bounce back more quickly in a recovery[13]. On the flip side, large companies are better positioned to endure a recession, but may be slower to recover. Research conducted by Research Gate supports these findings, by concluding: “Small-cap firms outperform large caps over the year subsequent to an economic trough. In the year prior to the business cycle peak, however, small caps tend to lag. US style based large caps perform better over peaks, but there is no dominant category across size and book to market asset classes over troughs.”[14]
Similar to the value/growth analysis described earlier, Putnam also analyzed the performance of small vs. large caps during a recession and concluded the following: “Looking back at the recessions of 1980, 1982, 1991, 2001 and 2009, large-cap stocks tended to outperform small cap in the months going into and during the early part of a recession. As the economy exits a recession, small caps tended to outperform large cap for the next three years.”[15]
Performance of Non-Fundamental Factors: ESG
Recently, the boom in ESG (environmental, social, and governance) investing has led researchers to analyze the performance of ESG factors during times of market volatility. This research tends to support the hypothesis that sustainable companies tend to enjoy lower downside risk and are resilient during volatile times. An analysis by the European Corporate Governance Institute found that “stocks with higher [ESG] ratings have significantly higher returns, lower return volatility, and higher operating profit margins during the first quarter of 2020. [ESG]firms with higher advertising expenditures experience higher stock returns, and stocks held by more [ESG]-oriented investors experience less return volatility during the crash.”[16] Hoepner et al. found empirical evidence that engagement with ESG issues reduces downside risk[17]. Ilhan et al. show that firms with poor ESG profiles, measured by higher carbon emissions, have higher tail risk[18]. Research conducted by Broadstock et al. about the performance of ESG during the market volatility surrounding the COVID-19 crisis found that “(i) high-ESG portfolios generally outperform low-ESG portfolios (ii) ESG performance mitigates financial risk during financial crisis and (iii) the role of ESG performance is attenuated in ‘normal’ times, confirming its incremental importance during crisis.”[19]
In Summary: What Types of Equities Outperform During Recessions?

Investing in Fixed Income (Think: Bonds)
Fixed income tends to be a larger part of an individual’s portfolio later in life, as risk tolerance decreases, and liquidity/cash flow needs may increase. The lowest-risk types of fixed income assets are government bonds, inflation-linked bonds, and investment grade corporate bonds. Each of these types pays out moderate interest/coupon payments to investors, has low correlation with public equities, and can reduce the portfolio impact of market downturns. Short-term bonds are used for parking cash, medium-term and longer-term bonds are used primarily for income generation to meet spending needs. High yield instruments (aka called junk bonds) pay higher interest rates because they have lower credit ratings, which results in higher risk, especially during market downturns.
Investing in Real Estate
There are several ways to get exposure to real estate as an asset class. Private real estate opportunities include direct investment into real estate such as commercial properties, residential properties, or even raw land. A study by the Black Creek Group in 2018 found that private real estate delivered higher returns, lower volatility, and stronger risk-adjusted returns than public real estate over the past 20 years[20]. While, private real estate may provide higher returns or diversification opportunities, but most people can’t just up and purchase (and manage) properties. This is where public real estate comes in. As defined by the National Association of REITS: real estate investment trusts (or REITs), are publicly traded companies that own or finance income-producing real estate across a range of property sectors[21].
Because of real estate’s inflation-hedging properties, real estate typically performs best during economic expansions and during initial economic slowdowns, when inflation is high. During expansions or periods with high inflation, real estate benefits from (1) capital gains from property and/or land value increases and (2) increases in rental income. On the flip side, real estate holdings are negatively affected by falling inflation or deflation, which puts downward pressure on rental income and property values. Sub-prime properties tend to be the most impacted, because they may have to cut rents sharply to avoid rising vacancies.
Investing in Other Alternatives (Think: Real Assets and Hedge Funds)
Starting with real assets – these are a category of physical assets that tends to be correlated to inflation (however commodities such as gold can actually be used as an inflation hedge). Real assets may include tradeable commodities (like metals, energy products, livestock, and agricultural products), farmland investments, energy investments, and infrastructure investments. Tradeable commodities perform well during economic expansions and periods of higher inflation, and they reduce the overall risk in your investment portfolio due to their low correlation to other asset classes. Investing in farmland can look like either buying the farmland and paying a farmer to farm the land or buying the farmland and leasing it back to the farmer. Farmland investments can be extremely lucrative, but there are potential risks related to the actual farming, performance of the commodity being farmed, and additional legal and regulatory risks. Energy investing has a long-time horizon, because it involves the exploration, development transportation, and delivery of energy products such as oil and gas. Public energy investments as well as direct energy investing are cyclical and perform best during economic expansion. Finally, infrastructure investments involve the construction and maintenance of public infrastructure such as toll roads, bridges, and airports. These investments provide stable and moderate-income growth with very little maintenance but can involve regulatory risks and constraints.
Because direct investments in hedge funds are available only to those investors with over $1 million in assets, we won’t spend a ton of time here. Hedge funds tend to function as vehicles with a high risk/reward trade off and are less correlated to other asset classes.
FOOTNOTES:
[6] Bureau of Economic Analysis
[7] Bureau of Labor Statistics
[16] European Corporate Governance Institute
DISCLAIMER:
The information in the Blog constitutes the authors’ own opinions (and any guest bloggers posting from time to time) and it should not be regarded as a description of services or opinions provided by Pickering Energy Partners LP.
The opinions expressed in the Blog are for general informational purposes only and are not intended to provide specific advice or recommendations for any individual or on any specific security or investment product. The views reflected in the commentary are subject to change at any time without notice.
Nothing on this Blog constitutes investment advice or any recommendation that any security, portfolio of securities, investment product, transaction or investment strategy is suitable for any specific person. You should not use this Blog to make financial decisions and we highly recommended you seek professional advice from someone who is authorized to provide investment advice.